library(tidyverse)
library(here)
library(rio)
library(janitor)

linelist <- import(here("processed_data", "combined_linelist.rds"), trust = TRUE)Session 8: Programming — Functions, if/else, Loops, and Iteration
Writing functions, if/else and if_else(), for loops, and iteration with map() and walk()
NoteIn this session you will learn to
This session is optional / advanced: it builds on everything before it, especially vectors and subsetting (Session 4) and plotting (Sessions 6 and 7).
- Write your own functions with arguments and default values
- Write functions that work on data frames and return tables or plots
- Use
if/elsefor one value andif_else()for a whole column, and explain the difference - Repeat a task with a
forloop — for example, saving one epidemic curve per hospital - Do the same with
map()/walk()from purrr (part of the tidyverse)
Before you start: open the workshop folder in Positron (File → Open Folder…) and open student_scripts/Session 8 - Programming_STUDENT.R. This session starts from processed_data/combined_linelist.rds and processed_data/measles_final.rds, which you saved in Session 3. If you missed it, ready-made copies are already in processed_data/.
Today’s goal: “Your manager wants an epidemic curve for every hospital, every week.” By the end of the session, one loop does it.
Where this session fits. Most data projects go through the same steps, whatever the topic. This session covers the last one, Automate (highlighted): turning steps you repeat into functions and loops, so one line of code redoes the whole job, for example next week’s epidemic curves.
- Import
- Inspect
- Clean
- Combine
- Reshape
- Summarize
- Visualize
- Save and share
- Automate
Part 1: Set up
👀 Follow along 1.1 — Load tidyverse, here, rio, and janitor, and import combined_linelist.rds as linelist.
Part 2: Writing your first function
Why write functions?
If you copy and paste code more than twice, write a function. Functions:
- avoid copy-paste mistakes (change it once, fixed everywhere)
- give a task a clear name (
c_to_f()says what it does) - make your scripts shorter and easier to read
The shape of a function
👀 Follow along 2.1 — Write c_to_f(temp_c) and test it on 38 and on c(36.8, 38.5, 40.1) (the next two code blocks).
c_to_f <- function(temp_c) {
  temp_c * 9 / 5 + 32
}c_to_fis the name — you save a function with<-like any object. Run the whole block to create it; then it appears in the Variables panetemp_cis the argument — the input. Inside the function, it is whatever value you pass in- The code between
{ }is the body - The function returns the result of its last line
c_to_f(38)[1] 100.4c_to_f(c(36.8, 38.5, 40.1)) # it's vectorized, because the maths inside is[1] 98.24 101.30 104.18Because it’s vectorized, it works on a whole column inside mutate():
👀 Follow along 2.2 — Use c_to_f() inside mutate() to add temp_f to linelist.
linelist %>%
  mutate(temp_f = c_to_f(temp)) %>%
  select(case_id, temp, temp_f) %>%
  head(3)
case_id temp temp_f
1 5fe599 36.8 98.24
2 8689b7 36.9 98.42
3 11f8ea 36.9 98.42Default values
Give an argument a default with =. You can change it, but you don’t have to:
👀 Follow along 2.3 — Add a digits = 1 default argument with round().
c_to_f <- function(temp_c, digits = 1) {
  round(temp_c * 9 / 5 + 32, digits)
}

c_to_f(38.37)              # uses digits = 1
[1] 101.1c_to_f(38.37, digits = 0) # overrides it[1] 101
WarningCommon mistakes
- Changing the function but not re-running the block: R still uses the old version.
Part 3: Functions that use data
A calculation used in many places
👀 Follow along 3.1 — Write pct(x, digits = 1), which returns round(mean(x, na.rm = TRUE) * 100, digits), and use it in summarise() by hospital.
pct <- function(x, digits = 1) {
  round(mean(x, na.rm = TRUE) * 100, digits)
}

linelist %>%
  group_by(hospital_name) %>%
  summarise(
    n         = n(),
    pct_death = pct(outcome == "Death"),
    pct_fever = pct(fever == "yes")
  )
# A tibble: 7 × 4
hospital_name n pct_death pct_fever
<chr> <int> <dbl> <dbl>
1 Central Hospital 454 42.5 77.3
2 HMO Health 280 44.3 92.9
3 Military Hospital 896 44.5 79
4 Other/Unknown 2354 42.7 77.3
5 Premiere Health 274 47.1 94.5
6 Regional Medical center 1771 44.6 76.7
7 St. Mark's Maternity Hospital 422 47.2 75.8Compare with Session 5, where we wrote round(mean(...) * 100, 1) every time.
A function that takes a data frame
👀 Follow along 3.2 — Write hospital_summary(data, hospital) and try it on two hospitals.
hospital_summary <- function(data, hospital) {
  data %>%
    filter(hospital_name == hospital) %>%
    summarise(
      n         = n(),
      pct_death = pct(outcome == "Death")
    )
}

hospital_summary(linelist, "Military Hospital")
n pct_death
1 896 44.5hospital_summary(linelist, "Central Hospital") n pct_death
1 454 42.5hospital is an argument holding a value (the hospital’s name), so it can go straight into filter().
A function that makes a plot
👀 Follow along 3.3 — Write make_epicurve(data, hospital), which returns a weekly epicurve for one hospital, with the hospital’s name in the title.
make_epicurve <- function(data, hospital) {
  data %>%
    filter(hospital_name == hospital, onset_date >= as.Date("2014-01-01")) %>%
    ggplot(aes(x = onset_date)) +
    geom_histogram(binwidth = 7, fill = "#2a78d6", color = "white") +
    labs(
      title = paste("Weekly cases:", hospital),
      x     = "Week of onset",
      y     = "Number of cases"
    ) +
    theme_minimal()
}

make_epicurve(linelist, "Military Hospital")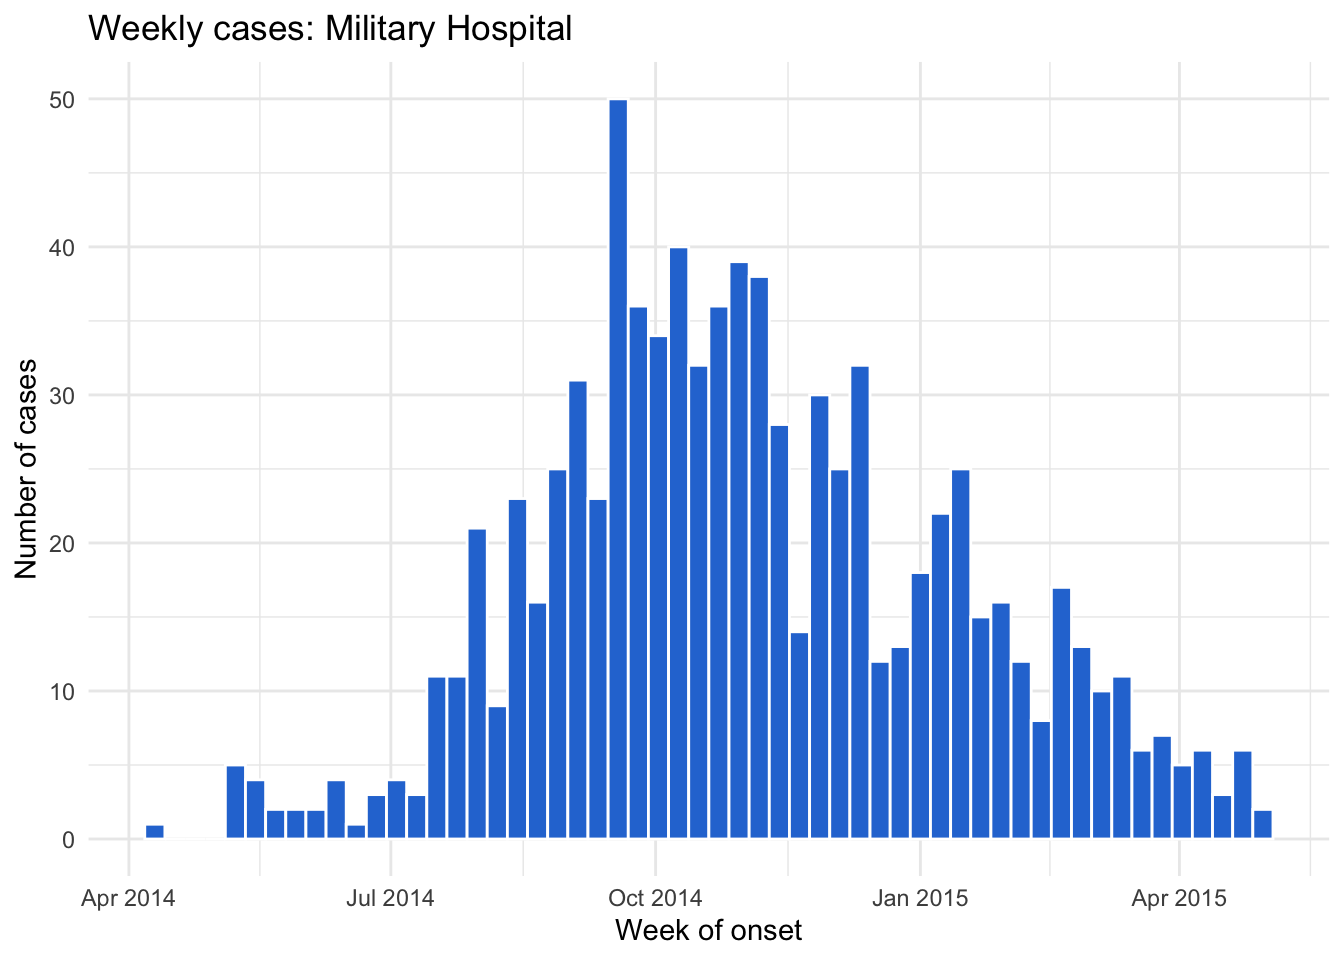
paste("Weekly cases:", hospital) builds the title from the argument, so every plot gets the right title.
WarningCommon mistake: name the argument
district_name, not district
Don’t give an argument the same name as a column! In
function(data, district) { data %>% filter(district == district) }R compares the district column with itself, so every row is kept — no error, just the wrong answer. Name the argument district_name instead: filter(district == district_name).
Part 4: if / else
if runs code only when a condition is TRUE. else runs when it’s FALSE:
👀 Follow along 4.1 — Write fever_status(temp) with if / else, and test it on 39.2 and 36.9.
fever_status <- function(temp) {
  if (temp >= 38) {
    "fever"
  } else {
    "no fever"
  }
}

fever_status(39.2)
[1] "fever"fever_status(36.9)[1] "no fever"if works on ONE value
👀 Follow along 4.2 — What happens with fever_status(c(39.2, 36.9))?
fever_status(c(39.2, 36.9))Error in `if (temp >= 38) ...`:
! the condition has length > 1if asks one yes/no question. For a whole column, use the vectorized if_else() from Session 2:
👀 Follow along 4.3 — The vectorized version with if_else(), used in mutate() on linelist.
fever_status <- function(temp) {
  if_else(temp >= 38, "fever", "no fever")
}

fever_status(c(39.2, 36.9))
[1] "fever" "no fever"linelist %>%
mutate(fever_measured = fever_status(temp)) %>%
count(fever_measured) fever_measured n
1 fever 4976
2 no fever 1324
3 <NA> 151Where if shines: checking inputs
if is perfect for questions with one answer, like “is the input a number?”. stop() ends the function with a helpful error message:
👀 Follow along 4.4 — Add an input check with stop() to c_to_f(), and try c_to_f("38").
c_to_f <- function(temp_c, digits = 1) {
  if (!is.numeric(temp_c)) {
    stop("temp_c must be a number, not ", class(temp_c))
  }
  round(temp_c * 9 / 5 + 32, digits)
}

c_to_f("38")
Error in `c_to_f()`:
! temp_c must be a number, not characterPart 5: for loops
A for loop runs the same code once for each value in a vector:
👀 Follow along 5.1 — A loop that prints two hospital names.
for (h in c("Central Hospital", "Military Hospital")) {
  print(h)
}
[1] "Central Hospital"
[1] "Military Hospital"Read it as: “for each h in this vector, run the code between { }”. h takes each value in turn.
Loop over every hospital
👀 Follow along 5.2 — Make the hospitals vector (without “Other/Unknown”), then loop and print the number of cases at each.
hospitals <- linelist %>%
  filter(hospital_name != "Other/Unknown") %>%
  distinct(hospital_name) %>%
  pull(hospital_name) %>%
  sort()

hospitals
[1] "Central Hospital" "HMO Health"
[3] "Military Hospital" "Premiere Health"
[5] "Regional Medical center" "St. Mark's Maternity Hospital"for (h in hospitals) {
n_cases <- sum(linelist$hospital_name == h)
print(paste(h, "has", n_cases, "cases"))
}[1] "Central Hospital has 454 cases"
[1] "HMO Health has 280 cases"
[1] "Military Hospital has 896 cases"
[1] "Premiere Health has 274 cases"
[1] "Regional Medical center has 1771 cases"
[1] "St. Mark's Maternity Hospital has 422 cases"Inside a loop, results are not printed automatically — use print().
Save the results
To keep results, create an empty container before the loop and fill it inside:
👀 Follow along 5.3 — Save the counts in case_counts.
case_counts <- c()   # an empty vector

for (h in hospitals) {
  case_counts[h] <- sum(linelist$hospital_name == h)
}

case_counts
Central Hospital HMO Health
454 280
Military Hospital Premiere Health
896 274
Regional Medical center St. Mark's Maternity Hospital
1771 422 The payoff: one epidemic curve per hospital
👀 Follow along 5.4 — The payoff: loop over hospitals and ggsave() one epicurve each to outputs/.
for (h in hospitals) {
  p <- make_epicurve(linelist, h)
  file_name <- paste0("epicurve_", make_clean_names(h), ".png")
  ggsave(here("outputs", file_name), plot = p, width = 8, height = 5, dpi = 300)
}make_clean_names()(janitor) turns “St. Mark’s Maternity Hospital” intost_marks_maternity_hospital— safe for a file namepaste0()glues the pieces with no spaces intoepicurve_st_marks_maternity_hospital.png- Six files, one loop. Next week, re-run it with the new data — check the Explorer to see the new files in
outputs/
NoteYou’ve already been looping
mutate(), summarise() with group_by(), and across() all repeat work for you. In R, reach for those first; write a loop when you need to repeat a whole task, like making and saving a plot.
Part 6: Iteration the tidyverse way: map() and walk()
The purrr package (part of the tidyverse) does what loops do, in one line:
map(x, f)— runfon each element ofxand return a list of resultsmap_dbl()— the same, but return a number vectorwalk(x, f)— runfon each element for its side effect (like saving a file), return nothing
👀 Follow along 6.1 — map_dbl() for the mean of age_years, bmi, and temp.
# The mean of three columns
linelist %>%
  select(age_years, bmi, temp) %>%
  map_dbl(~ mean(.x, na.rm = TRUE))
age_years bmi temp
16.05732 30.59385 38.58784 A data frame is a list of columns, so map_dbl() runs once per column. ~ mean(.x, na.rm = TRUE) is a short function: .x is the current element — the same ~ .x you used with across() in Session 3.
👀 Follow along 6.2 — map() to make a list of epicurves, one per hospital; look at the first.
# A list of six plots
epicurves <- map(hospitals, ~ make_epicurve(linelist, .x))
length(epicurves)
[1] 6epicurves[[1]]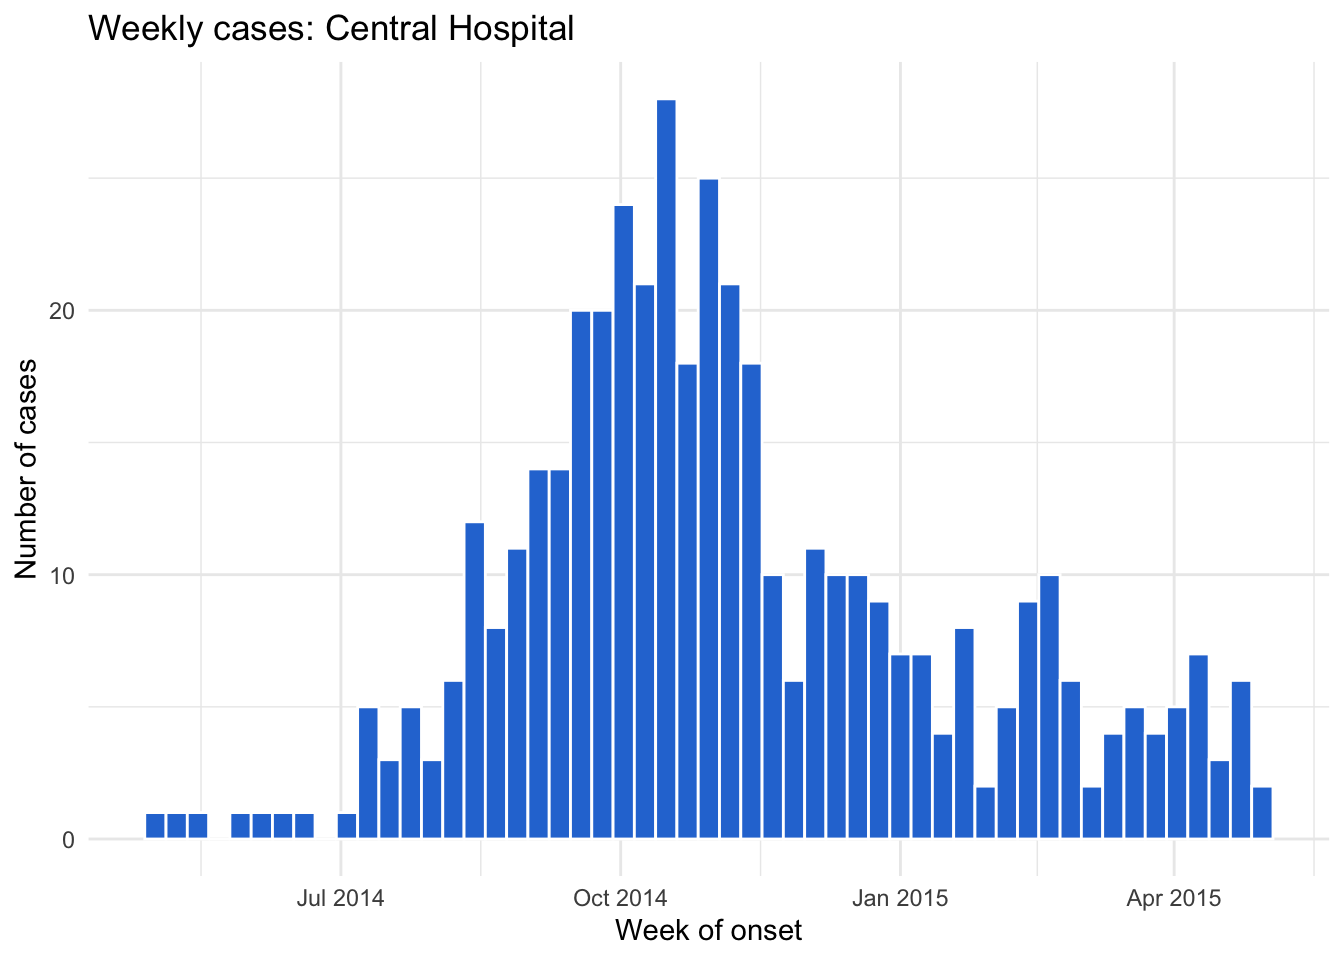
👀 Follow along 6.3 — walk() to save them all (the same as the Part 5 loop).
# Save them all: the same as the for loop in Part 5, in one call
walk(hospitals, ~ ggsave(
  here("outputs", paste0("epicurve_", make_clean_names(.x), ".png")),
  plot = make_epicurve(linelist, .x), width = 8, height = 5, dpi = 300
))
NoteLoop or
map()?
Both are fine! Loops are easier to read when you’re starting out; map() is shorter and is what you’ll see in modern R code. Choose the one you can read.
Note🔁 The base R way:
lapply() and sapply()
Base R’s apply family does the same job, and you will see it everywhere in older code, help pages, and bioinformatics packages (Bioconductor):
| purrr | base R | returns |
|---|---|---|
map(x, f) |
lapply(x, f) |
a list |
map_dbl(x, f) |
sapply(x, f) (or vapply(x, f, numeric(1))) |
a vector, usually |
🔁 Follow along 6.4 — The base R way: sapply() and lapply() on age_years, bmi, and temp, with mean and with range. Which one returns a matrix?
three_cols <- linelist[, c("age_years", "bmi", "temp")]

sapply(three_cols, mean, na.rm = TRUE)    # like map_dbl()
age_years bmi temp
16.05732 30.59385 38.58784 lapply(three_cols, range, na.rm = TRUE) # like map(): a list$age_years
[1] 0 84
$bmi
[1] 10.9 60.0
$temp
[1] 35.2 40.8sapply(three_cols, range, na.rm = TRUE) # surprise: a matrix! age_years bmi temp
[1,] 0 10.9 35.2
[2,] 84 60.0 40.8Extra arguments (na.rm = TRUE) go after the function name. sapply() guesses the shape of the result: a vector, a matrix, or a list. That guessing is why purrr has map_dbl(), map_chr(), and friends, which always return the type their name says. For your own functions, the base R shorthand is \(x) mean(x, na.rm = TRUE), the same idea as ~ mean(.x, na.rm = TRUE).
Tip⭐ Bonus
- Add a
fillargument tomake_epicurve(), with a default of"#2a78d6", so you can choose the bar color. - Add an input check to
rate_per_10k():stop()if population is 0 or missing. - Write a function that makes the whole measles Table 1 from Session 5, and run it for each district with
map(). - Brought your own data? Find a piece of code you copied and pasted, and turn it into a function.
See the solutions file for answers.
Key points
- Write it once, run it many times: if you copy and paste code more than twice, write a function with
function(). - A function takes arguments (which can have default values) and returns the result of its last line. Re-run the block after every change.
- Never give an argument the same name as a column — use
district_name, notdistrict. if/elseworks on one value (great for input checks withstop());if_else()works on a whole column.- A
forloop repeats a whole task for each value; create an empty container before the loop to keep results. map()returns a list,map_dbl()a number vector, andwalk()just does something (like saving files) for each element. In base R code you will seelapply()(always a list) andsapply()(it guesses the shape).
Where to go next: R for Data Science (free online) — chapters on functions and iteration; The Epidemiologist R Handbook — applied examples for public health.